忘れない内にメモメモ。IntelliJ Ideaでも同じやり方でいけると思いますが、まだ未確認。
試したバージョンは、WebStorm 2016.2.4.
WebStormでElectronアプリをデバッグするやり方については、JetBrainsのブログにて既にあります。
Getting started with Electron in WebStorm | WebStorm Blog
なんですが、この記事Mac版を元にして書いてあるのもあって、そのとおりにやってもWindows版だとうまく行きませんでした。(Create Processなんちゃらってエラーが出る)
で、以下の設定でデバッグできました。
- Run/Debug Configuration画面を開いて、「Node.js」の構成を新規追加
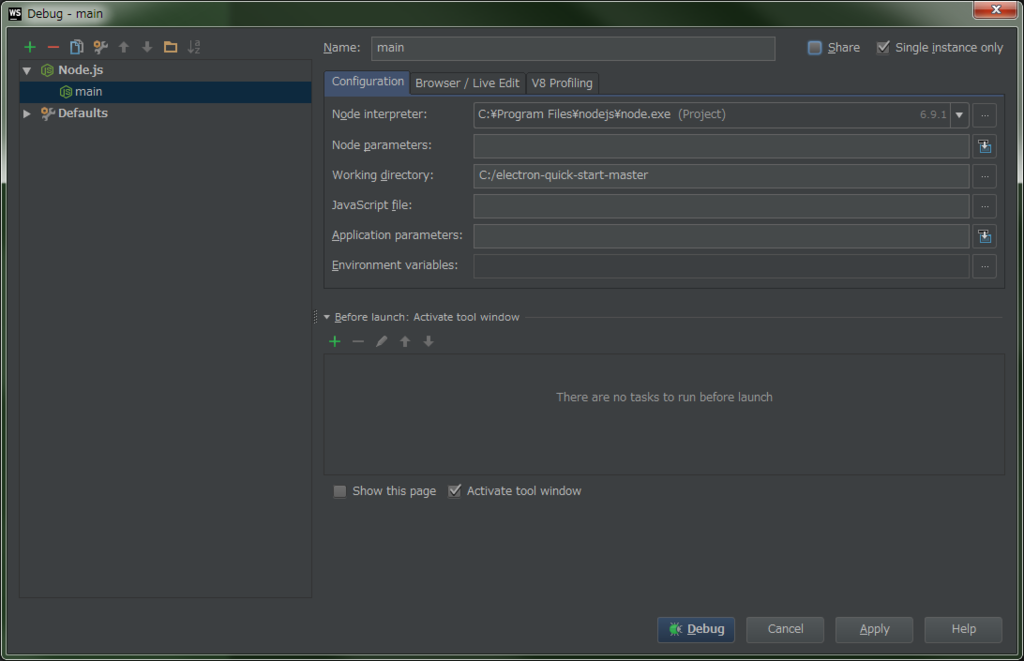
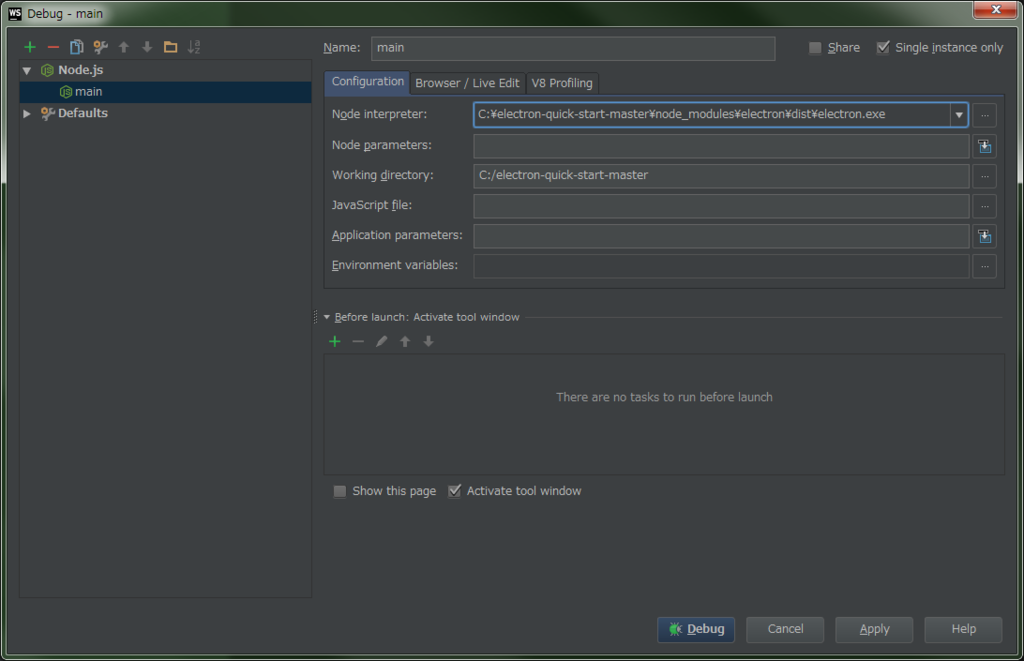
- Node Interpreterをnode_modulesの下のelectron/dist/electron.exeにする。(.binの下のelectronだとダメ)
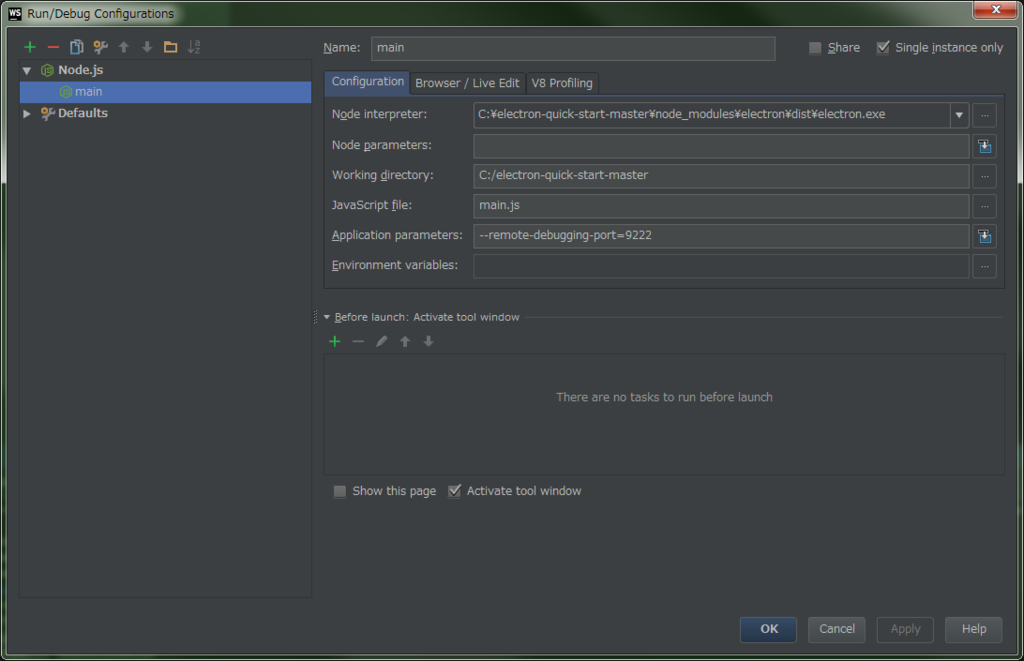
- Javascript fileに「main.js」を指定
- Application Parametersに「--remote-debugging-port=9222」を指定
これで、ちゃんと起動しました。ブレークポイントもオッケイ。
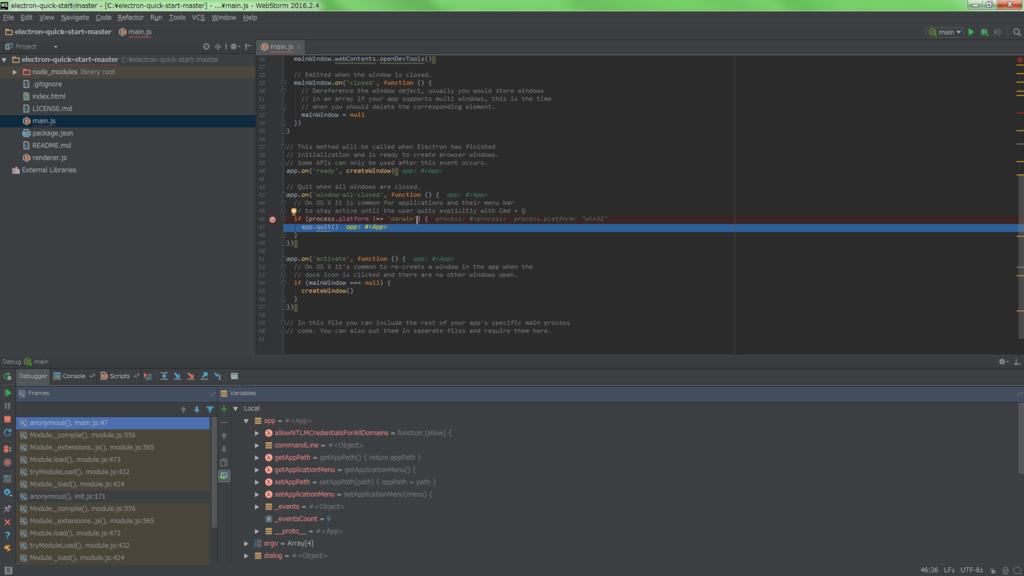
あと、デバッグを開始すると以下のエラーがコンソールに出ます。
ReferenceError: v8debug is not defined
    at eval (eval at <anonymous> (C:\electron-quick-start-master\main.js:1:1), <anonymous>:44:21)
    at eval (eval at <anonymous> (C:\electron-quick-start-master\main.js:1:1), <anonymous>:86:5)
    at C:\electron-quick-start-master\main.js:1:1
    at ContextifyScript.Script.runInThisContext (vm.js:25:33)
    at Object.exports.runInThisContext (vm.js:77:17)
    at Module._compile (module.js:528:28)
    at Object.Module._extensions..js (module.js:565:10)
    at Module.load (module.js:473:32)
    at tryModuleLoad (module.js:432:12)
    at Function.Module._load (module.js:424:3)
これなんですが、上記のJetbrainsのブログ記事のコメント欄にて既に質問されている方がいらっしゃって返答があります。
Please ignore this message (it’s related to the upcoming changes in the Node.js debugging protocol), it should not affect debugging your app. Sorry for confusion.
気にすんなって事らしいです。
あと、ブログ記事にて、「Preference」の下の~ って記述がありますが、Windows版ではどこ探しても「Preference」ってメニュー項目はありません。
Windows版では、「Settings」という名前になります。
これプラス、Devtronとか入れておいたら、幸せになれそうな予感。
過去の記事については、以下のページからご参照下さい。
- いろいろ備忘録日記まとめ
サンプルコードは、以下の場所で公開しています。
- いろいろ備忘録日記サンプルソース置き場
